Analysis on Federal Business Innovation and Growth Support to Clean Technology, 2016 to 2020
19 min read
Acknowledgments
The authors would like to thank Syeda Batool and Sarah Feng at the Data Science, Research and Development Unit at the Treasury Board of Canada Secretariat, as well as Kerem Soyak at the Clean Growth Hub at Innovation, Science and Economic Development Canada, for their collaboration and feedback throughout the study.
Abstract
This analysis provides a first-ever snapshot of the businesses performing clean technology activities that have been funded by the federal government through Business Innovation and Growth Support (BIGS) programs. In 2020, the BIGS database covered a total of 123 programs delivered by 18 federal departments, of which 15 were clean technology programs. Over the past five years, the BIGS database covered a total of 172 programs delivered by 19 departments. As well, BIGS programs have provided support to an average of 23,276 enterprises per year, while an average of 918 enterprises were supported by clean technology programs.
Highlights
- The number of clean technology (clean tech) beneficiaries increased from 436 to 1,335 enterprises between 2016 and 2020, and the total value of the federal support increased from $84 million to $394 million in the same period.
- Clean tech supported businesses are smaller and newer and report higher growth compared with businesses supported by federal Business Innovation and Growth Support (BIGS) programs in general.
- In 2020, clean tech supported businesses invested $200,000 more on average in research and development and exported $61 million more on average, compared with all BIGS-supported businesses.
- Ownership of clean tech supported businesses is less diverse, but the workforce is more educated, compared with all BIGS-supported businesses.
Introduction
The Government of Canada offers financial and service-based support to businesses through programs that provide activities such as funding, consulting services to enterprises, industry-facing research and development (R&D), support provided directly or in partnership, and support for technology development and exports. In partnership with the Treasury Board Secretariat, Statistics Canada produces information about the impact of these programs on their recipients via the Business Innovation and Growth Support (BIGS) statistical program. The government offers BIGS with the aim to increase business economic performance, support high-performing businesses and contribute to improved diversity outcomes in businesses by boosting the participation of underrepresented groups in the economy. It also aims to create jobs, increase wages and lead to technological advancements. As of 2020, the BIGS database contained 123 federal programs that cover support for clean technology (clean tech), commercialization, exports, R&D and business productivity.
Clean tech has been an emerging area of policy research with the increasing importance of reducing environmental impacts. It is defined as any good or service designed with the primary purpose of contributing to remediating or preventing any type of environmental damage or any good or service whose primary purpose is not environmental protection but that is less polluting or more resource-efficient than equivalent normal products that furnish a similar utility. The clean tech sector is an important part of the Canadian economy, with governments and businesses playing a key role in its development. The value of the environmental and clean tech products sector in Canada accounted for 3.1% of Canadian gross domestic product (GDP) in 2020, and the share of the environmental and clean tech products GDP out of total GDP has remained relatively stable since the beginning of the time series in 2007.Note Note In its climate plan titled A Healthy Environment and a Healthy Economy, the Government of Canada outlines that “clean technology is a key driver of innovation, environmental improvements, economic growth and jobs,” with federal investments to clean tech totalling more than $3 billion between 2016 and 2020.Note Note As a result, more initiatives are focusing on clean tech and, within BIGS, there are numerous clean tech programs. Examples of projects funded through BIGS clean tech programs include clean and renewable energy, energy efficiency, low-carbon transition, and bioproducts.
Using BIGS data, this analysis targets the programs focused on supporting clean tech initiatives. This analysis provides a profile of businesses supported by federal BIGS clean tech programs compared with businesses supported by any BIGS programs. It explores the economic and social characteristics of these businesses by linking BIGS data to Statistics Canada’s Business Register (BR) and Business Linkable File Environment (B-LFE).Note This analysis highlights the economic contribution of support to clean tech in Canada and helps to inform policy and programs targeting clean tech businesses.
Number of clean tech programs continues to grow
Of the 123 programs covered by BIGS in 2020, 15 exclusively supported clean tech projects and enterprises (presented in Appendix Table A.1) and 22 broader ones supported—though not exclusively—clean tech projects. The number of clean tech programs has been increasing year over year, expanding from a low of 3 in 2016 to 13 in 2019.
In 2020, the total value of clean tech support was $394 million, representing 9.1% of all BIGS; 1,335 enterprises received this support, representing 4.8% of all BIGS beneficiaries.Note Note As shown in Table 1, clean tech support amounts have increased from a smaller portion in 2016 of $84 million, representing 4.4% of all BIGS, up to $108 million (5.7%) in 2017, $153 million (6.4%) in 2018 and $337 million (10.8%) in 2019. Likewise, clean tech supported businesses have increased from 436 beneficiaries in 2016 (1.9% of all BIGS beneficiaries) to 814 beneficiaries in 2017 (3.6%), 826 beneficiaries in 2018 (3.9%) and 1,178 beneficiaries in 2019 (5.3%).Note
| 2016 | 2017 | 2018 | 2019 | 2020 | |
|---|---|---|---|---|---|
| Number of clean tech programs | 3 | 4 | 10 | 13 | 15 |
| Value of clean tech support (thousands of dollars) | 84,133 | 108,458 | 152,762 | 337,488 | 393,715 |
| Number of clean tech beneficiaries | 436 | 814 | 826 | 1,178 | 1,335 |
Clean tech beneficiaries are mostly for-profit businesses
In 2020, 89.5% of all BIGS businesses were for-profit businesses, and, in parallel, 88.3% of beneficiaries of clean tech programs were for-profit businesses. In addition, the majority of clean tech support (82.0%) went to for-profit businesses, with 5.7% of clean tech support going to non-profit (non-government) businesses and 12.3% of clean tech support going to non-profit (government) businesses.Note Nearly two-thirds of clean tech support was provided directly to businesses by federal departments, whereas the remaining support was provided indirectly through intermediary organizations. By contrast, Chart 1 shows how intermediary organizations had a greater role in allocating clean tech funds to ultimate beneficiaries than they had in allocating BIGS funds in general, with 38.2% of clean tech funds transiting through intermediaries compared with 11.2% for all BIGS funds. While 3.3% of clean tech support went to projects involving the collaboration of multiple partners, this total amount was provided directly to these consortiums by federal departments.
Data table for Chart 1
| Type of beneficiary | Clean tech programs | All BIGS programs |
|---|---|---|
| percent | ||
| Direct | 61.8 | 88.8 |
| Indirect | 38.2 | 11.2 |
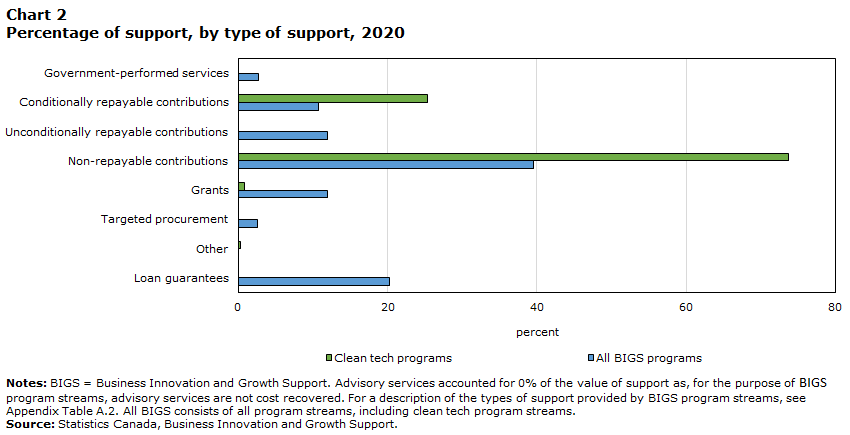
Clean tech support was provided to businesses in the form of conditionally repayable contributions, grants, non-repayable contributions and other financial support (a description of support types is presented in Appendix Table A.2). The following chart shows that the most common types of support received from clean tech programs were non-repayable contributions (73.7%), followed by conditionally repayable contributions (25.3%). While nearly three-quarters of clean tech support were provided in the form of non-repayable contributions, they accounted for only two-fifths of all BIGS.
Data table for Chart 2
| Type of support | Clean tech programs | All BIGS programs |
|---|---|---|
| percent | ||
| Advisory services | 0.0 | 0.0 |
| Government-performed services | 0.0 | 2.7 |
| Conditionally repayable contributions | 25.3 | 10.8 |
| Unconditionally repayable contributions | 0.0 | 12.0 |
| Non-repayable contributions | 73.7 | 39.6 |
| Grants | 0.8 | 12.0 |
| Targeted procurement | 0.0 | 2.6 |
| Other | 0.3 | 0.0 |
| Loan guarantees | 0.0 | 20.2 |
Clean tech beneficiaries are generally newer and smaller businesses
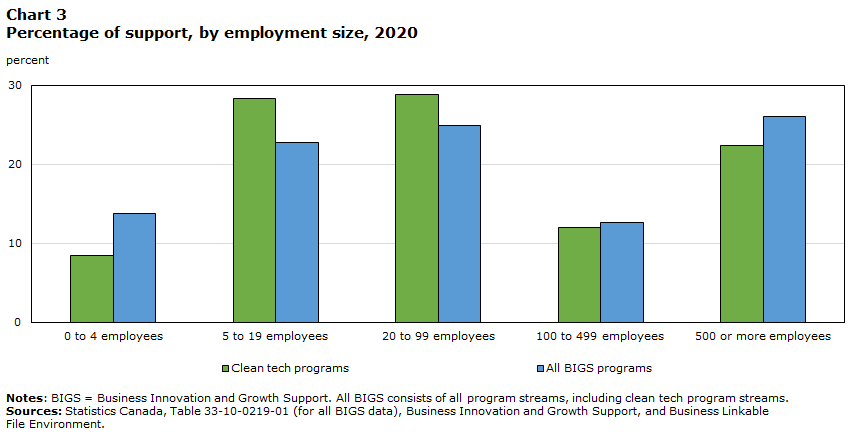
Charts 3 and 4 show the distributions of the value of support and number of enterprises by employment size. While 22.4% of all clean tech support was provided to large enterprises of 500 or more employees, 92.7% of clean tech beneficiaries were small and medium-sized enterprises (SMEs).Note A little over one-third of clean tech beneficiaries were enterprises that were established within the past five years (34.6%).
In terms of the average value of support per enterprise, clean tech supported SMEs received $226,000 on average from clean tech programs, which is higher than what all BIGS-supported SMEs received in general from any programs ($134,000 per SME on average). In contrast, large clean tech supported enterprises received a lower amount from clean tech programs ($835,000 per enterprise on average) than large enterprises received from any BIGS programs ($1,086,000 per enterprise on average).
Data table for Chart 3
| Employment size | Clean tech programs | All BIGS programs |
|---|---|---|
| percent | ||
| 0 to 4 employees | 8.4 | 13.7 |
| 5 to 19 employees | 28.3 | 22.8 |
| 20 to 99 employees | 28.9 | 24.9 |
| 100 to 499 employees | 12.0 | 12.6 |
| 500 or more employees | 22.4 | 26.0 |

Data table for Chart 4
| Employment size | Clean tech programs | All BIGS programs |
|---|---|---|
| percent | ||
| 0 to 4 employees | 21.6 | 31.0 |
| 5 to 19 employees | 41.4 | 34.9 |
| 20 to 99 employees | 23.3 | 22.1 |
| 100 to 499 employees | 6.4 | 7.9 |
| 500 or more employees | 7.3 | 4.2 |
As for the distribution of the value of support received from all BIGS programs, the four provinces with the greatest number of businesses—Ontario, Quebec, Alberta and British Columbia—received the highest proportions of the value of clean tech support. Manitoba and Saskatchewan received a relatively higher share of the value of clean tech support (2.5% and 6.2%, respectively) than their share of all the value of BIGS support received (2.1% and 2.9%, respectively), whereas Ontario and Quebec received a lower share of the value of clean tech support (31.3% and 16.8%, respectively) than their share of all the value of BIGS support received (36.2% and 25.0%, respectively).
In 2020, 19.8% of the total value of federal innovation support to Saskatchewan was allocated to clean tech businesses, the highest among all regions. In British Columbia, 16.6% of the total value of federal innovation support went to clean tech, and, in Manitoba, 10.9% of the total value of federal innovation support went to clean tech. While these three provinces had a higher concentration of clean tech support, these provinces also had the highest revenues from sales of environmental and clean tech goods and services. Ontario and Quebec accounted for 70% of all environmental and clean tech goods sold in 2020, followed by Saskatchewan and Manitoba combined, then British Columbia.Note The picture remains the same when looking at the order of the leading provinces within the Environmental and Clean Technology Products Economic Account. With respect to output, Ontario (37.9%) accounted for over one-third of the total value of environmental and clean tech products, while Quebec (24.6%) accounted for over one-quarter and British Columbia (15.4%) for one-seventh.Note
Services-producing sector receiving more clean tech support than goods-producing sector
By sector, the goods-producing industries received 39.1% of clean tech support and the services-producing industries received 60.9% of that support.Note However, the proportion of support received by goods-producing industries was higher from clean tech programs compared with all BIGS programs, where goods-producing industries received 24.2% of all support.
The number of clean tech beneficiaries represented 5.2% of all BIGS beneficiaries in the goods-producing sector and 4.9% of all BIGS beneficiaries in the services-producing sector. The amount of clean tech support represented 15.0% of total BIGS in the goods-producing sector and 7.4% of total BIGS in the services-producing sector.

Data table for Chart 5
| Industry | Clean tech programs | All BIGS programs |
|---|---|---|
| percent | ||
| Agriculture, forestry, fishing and hunting | 2.0 | 1.9 |
| Mining, quarrying, and oil and gas extractionData table for chart 5 Note 1 | 2.1 | 0.5 |
| Utilities | 16.0 | 2.3 |
| Construction | 3.1 | 1.6 |
| Manufacturing | 15.9 | 17.9 |
| Wholesale Trade | 4.2 | 2.3 |
| Retail Trade | 0.4 | 3.8 |
| Transporation and warehousing | 1.3 | 3.2 |
| Information and cultural industries | 1.1 | 4.5 |
| Finance and insurance | 0.4 | 0.7 |
| Professional, scientific and technical services | 28.8 | 24.6 |
| Management of companies and enterprises | 6.3 | 1.8 |
| Educational services | 4.1 | 15.4 |
| Health care and social assistance | 1.0 | 2.1 |
| Arts, entertainment and recreation | 0.0 | 0.8 |
| Accommodation and food services | 0.3 | 6.8 |
| Other services (except public administration) | 2.7 | 4.6 |
| Public administration | 8.3 | 3.0 |
| Other sectorsData table for chart 5 Note 2 | 2.0 | 2.1 |
In the goods-producing sector, the industries that had the highest proportion of clean tech beneficiaries were manufacturing (19.1%) and agriculture, forestry, fishing and hunting (6.9%). By contrast, the industries that had the highest proportion of the value of clean tech support were utilities (16.0%) and manufacturing (15.9%). In terms of the average value of support per enterprise, utilities had the highest, with an average of $2.2 million of clean tech support per enterprise.
In the services-producing sector, the professional, scientific and technical services industry and the public administration industry had the highest proportion of clean tech beneficiaries (37.9% and 6.2%, respectively) and the highest proportion of the value of clean tech support (28.8% and 8.3%, respectively). The management of companies and enterprises industry had the highest average value of support per enterprise in the services-producing sector, with an average of $1 million of clean tech support per enterprise.
The manufacturing industry and the professional, scientific and technical services industry benefited the most in Quebec, Ontario, and British Columbia and the territories. In Quebec, the agriculture, forestry, fishing and hunting industry had a high number of clean tech beneficiaries (6.6% of the province’s clean tech beneficiaries) and the utilities industry had a high amount of the province’s clean tech support (17.2%). In Ontario, the information and cultural industries comprised 6.6% of the province’s clean tech beneficiaries and the wholesale trade industry received 9.3% of the province’s clean tech support. For British Columbia and the territories, agriculture, forestry, fishing and hunting also had a high number of beneficiaries, with 10.9% of the region’s clean tech beneficiaries, and construction received 9.6% of the region’s clean tech support.
Results from support are higher among businesses benefiting from clean tech programs
In 2020, 625,000 people were employed by clean tech supported businesses, representing 13.8% of employees from all BIGS beneficiaries, and clean tech beneficiaries produced $187 billion in total revenue, representing 10.0% of the revenue generated by all BIGS beneficiaries. The percentage of employees from all BIGS beneficiaries who are employed by clean tech supported businesses increased from 12.8% in 2019 and 9.0% in 2018. Likewise, the percentage of the total revenue generated from BIGS beneficiaries that came from clean tech supported businesses increased from 9.9% in 2019 and 8.1% in 2018. When only SMEs were considered, 33,000 people were employed in clean tech supported businesses, and these SMEs produced $13 billion in total revenue. Clean tech beneficiaries invested $200,000 more on average in R&D and exported $61 million more on average compared with all BIGS beneficiaries.
Clean tech beneficiaries also have positive growth rates for many economic variables. The median three-year change in productivity for enterprises that received clean tech support between 2018 and 2021 was $14,300 per employee, compared with $13,500 per employee for all BIGS program participants. The median three-year percentage revenue growth from 2018 for clean tech beneficiaries was 13.3% (compared with 7.2% for all BIGS), and the median three-year percentage employment growth was 6.5% (compared with 2.4% for all BIGS). Taking a closer look at revenue growth for 2020, 21.4% of clean tech beneficiaries were high growth enterprisesNote compared to 16.3% of all BIGS beneficiaries that were high growth enterprises.
Many factors could explain the higher revenue and employment growth for clean tech beneficiaries, including the type of support and beneficiary. As previously mentioned, clean tech beneficiaries have a higher percentage of support received indirectly through intermediaries in the form of non-repayable contributions. This type of distribution of support is generally associated with higher revenue and employment growth.
In 2020, two-thirds (67.4%) of clean tech beneficiaries saw positive revenue growth compared with the previous year, whereas 57.4% of all BIGS-supported businesses had positive revenue growth over the same period. This finding was consistent with the proportion of clean tech beneficiaries with positive revenue growth in previous years. Revenue grew for 71.2% of clean tech supported businesses in 2019 and for 72.2% of clean tech supported businesses in 2018.

Data table for Chart 6
| AVG yearly growth in revenue | Clean tech programs | All BIGS programs |
|---|---|---|
| percent | ||
| 0 or negative growth | 32.6 | 42.6 |
| more than 0 to 10 percent growth | 63.3 | 54.2 |
| more than 10 percent growth | 4.1 | 3.2 |
Compared with all Business Innovation and Growth Support beneficiaries, the clean tech supported workforce is more educated but the ownership is less diverse
More employees in clean tech supported businesses had a university degree in 2019, compared with all BIGS-supported businesses. In 2019, the average share of workers’ education levels across clean tech supported businesses was 22.0% with a high school diploma or less, 22.7% with a trades certificate or college diploma, and 55.3% with a university degree or more.Note Across all education levels, the average annual wages for clean tech programs were above those for all BIGS programs. The share of total annual wages increases with the education level for clean tech beneficiaries and for all BIGS-supported businesses.

Data table for Chart 7
| Education level | Clean tech programs | All BIGS programs |
|---|---|---|
| millions of dollars | ||
| High school diploma or less | 3,567,712 | 6,235,983 |
| Trade certificate or college diploma | 6,640,721 | 14,650,169 |
| University degree or more | 10,597,297 | 20,715,281 |
The owners of clean tech beneficiaries were primarily male and born in Canada. Compared with all owners of BIGS beneficiaries, the owners of enterprises that received clean tech support were less diverse. Women-owned enterprises accounted for 17.0% of clean tech beneficiaries in 2020, and immigrant-owned enterprises accounted for 23.1% of clean tech beneficiaries in 2019 (20.3% and 21.1% of all BIGS beneficiaries, respectively).Note Although the diversity of owners is not evenly distributed, the number of women-owned clean tech beneficiaries rose from 2018 to 2020, increasing to 189 businesses in 2020 from 162 businesses in 2019 and 104 businesses in 2018.
Appendix
| Department/agency | Program stream name | Subprogram stream names | Year |
|---|---|---|---|
| Agriculture and Agri-Food Canada | Agricultural Clean Technology Program | Note …: not applicable | 2018, 2019, 2020 |
| Environment and Climate Change Canada | Low Carbon Economy Challenge | Note …: not applicable | 2019, 2020 |
| Fisheries and Oceans Canada | Fisheries and Aquaculture Clean Technology Adoption Program | Note …: not applicable | 2018, 2019, 2020 |
| Innovation, Science and Economic Development Canada | Sustainable Development Technology Canada | SD Tech Fund | 2016, 2017, 2018, 2019, 2020 |
| National Research Council of Canada | Industrial Research Assistance Program | Youth Employment Program | 2016, 2017, 2018, 2019, 2020 |
| Natural Resources Canada | Contributions in support of Clean Energy for Rural and Remote Communities Program | Note …: not applicable | 2018, 2019, 2020 |
| Natural Resources Canada | Contributions in support of Clean Growth in the Natural Resource Sectors Innovation Program | Note …: not applicable | 2019, 2020 |
| Natural Resources Canada | Contributions in Support of Electric Vehicles and Alternative Fuel Infrastructure Deployment Initiative | Note …: not applicable | 2017, 2018, 2019, 2020 |
| Natural Resources Canada | Contributions in Support of the Energy Innovation Program | Note …: not applicable | 2016, 2017, 2018, 2019, 2020 |
| Natural Resources Canada | Contributions in Support of the Smart Grid Program | Note …: not applicable | 2020 |
| Natural Resources Canada | Electric Vehicle Infrastructure Demonstration Program | Note …: not applicable | 2019, 2020 |
| Natural Resources Canada | Contributions in support of the Emerging Renewable Power Program | Note …: not applicable | 2018, 2019, 2020 |
| Natural Resources Canada | Energy Efficient Buildings Program | Note …: not applicable | 2018, 2019, 2020 |
| Natural Resources Canada | Grants and Contributions in support of Clean Technology Challenges (as part of the Impact Canada Initiative) | Note …: not applicable | 2018, 2019, 2020 |
| Natural Resources Canada | Oil and Gas Clean Tech Program | Note …: not applicable | 2020 |
| Type of support | Description | |||||||
|---|---|---|---|---|---|---|---|---|
| Advisory service | An external service where data, information or advice is conveyed to an enterprise. For the purpose of Business Innovation and Growth Support program streams, advisory services are not cost recovered. Examples of advisory services are increasing awareness of Government of Canada policies, programs and services or providing information through an online database, publication or call centre. | |||||||
| Non-repayable contribution | A form of contribution exempts from repayment for such purposes that are specified in the Directive on Transfer Payments. | |||||||
| Consortium member | An enterprise that is not the recipient of support but is a joint member of a project with at least one recipient of support. Support for this business is expected to have an economic impact. | |||||||
| Unconditionally repayable contribution | A transfer payment that is repayable in part or in full for which no condition of repayment is specified in a funding agreement. | |||||||
| Grant | A transfer payment subject to pre-established eligibility and other entitlement criteria. A grant is not subject to being accounted for by a recipient nor normally subject to audit by the department or agency. The recipient may be required to report on results achieved. | |||||||
| Service fully cost-recovered | A service that is provided to the client, where the cost of the service is assumed in full by the client. | |||||||
| Conditionally repayable contribution | A contribution where repayment obligations are triggered by predetermined events or circumstances and where repayment in full may not be required. | |||||||
| Service partially cost-recovered | A service that is provided to the client, where the cost of the service is partially but not completely assumed by the client. | |||||||
| Targeted procurement | Use of federal procurement as an instrument for business innovation or support programming to achieve economic or innovation policy objectives. | |||||||
Methodology
From September 27, 2021, to August 31, 2022, federal departments and agencies provided administrative data on program stream information for fiscal year 2020-2021 with the reference period of April 1, 2020 to March 31, 2021. Similar collection and reference dates were done for previous years. The data acquisition is based on a template filled in by the agencies and federal departments, with records of transactions for all innovation and growth support program streams. The data received by Statistics Canada are then treated, with editing of the transactions done in collaboration with the administrators of the program streams and Treasury Board Secretariat subject-matter specialists, and then linked to the Business Linkable File Environment at the enterprise level. Data of interest from the Business Linkable File Environment were extracted for each matched enterprise to create a linked microdata set that was used to produce tabular estimates and econometric analysis.
References
Statistics Canada, Business Innovation and Growth Support and Business Linkable File Environment (2023).
Statistics Canada (2022). Environmental and Clean Technology Products Economic Account, 2020. Ottawa, Canada : Statistics Canada, January (https://www150.statcan.gc.ca/n1/daily-quotidien/220106/dq220106d-eng.htm).
Government of Canada (2021). A Healthy Environment and a Healthy Economy. Ottawa, Canada : Environment and Climate Change Canada, March (https://www.canada.ca/en/services/environment/weather/climatechange/climate-plan/climate-plan-overview/healthy-environment-healthy-economy.html).
Statistics Canada (2022). Annual Survey of Environmental Goods and Services, 2020. Ottawa, Canada : Statistics Canada, March (https://www150.statcan.gc.ca/n1/daily-quotidien/220323/dq220323e-eng.htm).